Seeing the Forest: Unpacking the Relationship Between MMSD Graduation Rates and Student Achievement
Dear Simpson Street Free Press:
Thank you for looking more closely at recent reports of an increase in MMSD minority student graduation rates and related issues:
Are Rising MMSD Grad Rates Something to Celebrate?
Madison’s ACT College Readiness Gap
Inspired by your excellent work, we decided to dig deeper.
We call the result of our efforts Seeing the Forest: Unpacking the Relationship Between MMSD Graduation Rates and Student Achievement.
We hope Simpson Street Free Press readers will take the time to read our brief report and reflect on its findings.
Sincerely,
Laurie Frost, Ph.D.
Jeff Henriques, Ph.D.
August 20, 2018
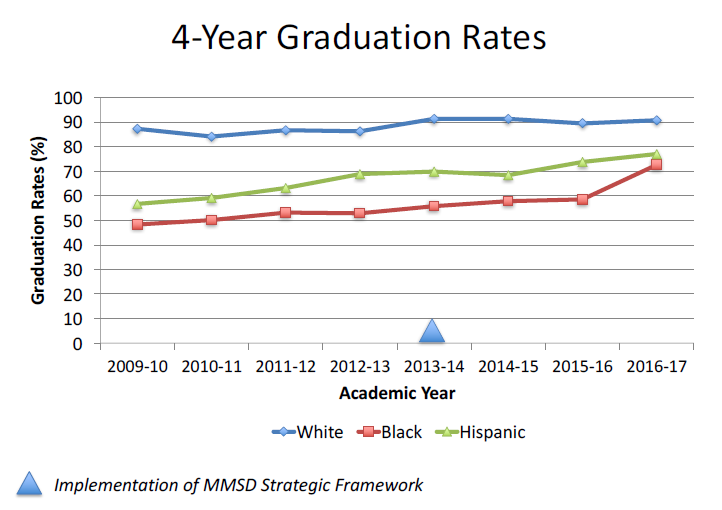
Much has been made about the recent (Class of 2017) increase in MMSD high school graduation rates, especially for Black students.
The graph below displays MMSD graduation data (as reported by the DPI) for the past eight years for White, Black, and Hispanic students. As you can see, in 2016-17, Hispanic students showed a 3.3% increase in graduation rate over the previous year and Black students showed an astounding 14.1% increase. Compared to their peers in the Class of 2013 (the year prior to the implementation of the MMSD’s Strategic Framework), the Hispanic and Black students in the Class of 2017 showed an 8.2% and 19.8% increase in graduation rates, respectively.
We will leave it to others to determine what accounts for the increase in minority student
graduation rates – whether it is due, for example, to procedural changes in the way high school
graduates are tallied; other (possibly questionable) data reporting practices; interventions that
have produced bona fide improvements in student achievement; or a lower bar for success
(including graduation) due to grade inflation, non-rigorous alternative educational options,
and/or watered-down credit recovery programs (practices that have been the focus of
investigative reports in other parts of the country).
For us, the important question is: Has the increase in minority student graduation rates been
accompanied by an increase in minority student learning and achievement? Put another
way, as we graduate an increasing number of our minority students, are we graduating more
minority students who are college ready? who can read and do math at grade level?
We believe the best way to determine college readiness is with the ACT, which all MMSD
juniors have been required to take since 2013-14.
Though far from perfect, the ACT is a widely
used standardized test with well-established and well-documented reliability and validity. It
yields objective performance data in the core academic areas, data that allow for meaningful
comparisons across time, geography, and demographics. Grades (and GPA), in contrast, are
somewhat subjective and “squishy”. They are locally determined and, in practice, easily
influenced – whether consciously or unconsciously – by the adults’ desire for success, both their
own and their students’, especially during times of strong administrative and societal pressure
for that success.
The ACT defines college readiness benchmark scores as the level of achievement (in terms of
ACT test performance) required for a student to have at least a 75% chance of earning a C or
better in an introductory college course in the same content area. Since 2013, the ACT-based
college readiness benchmark score for both Reading and Math has been 22. (Before 2013, the
benchmark score was 21 for Reading and 22 for Math.)
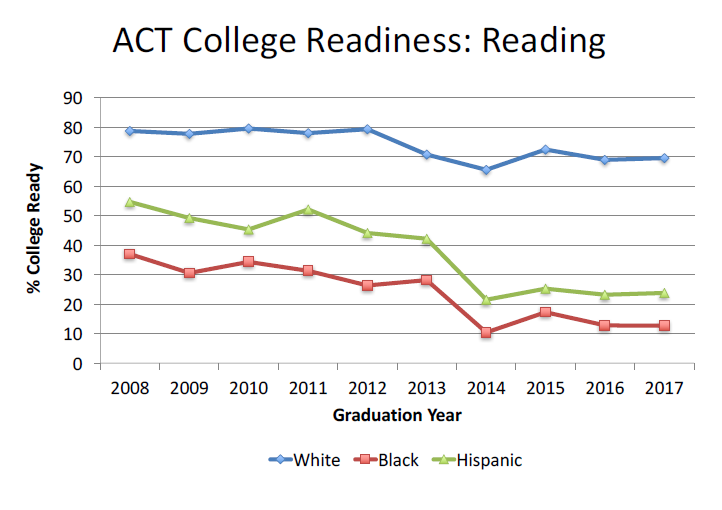
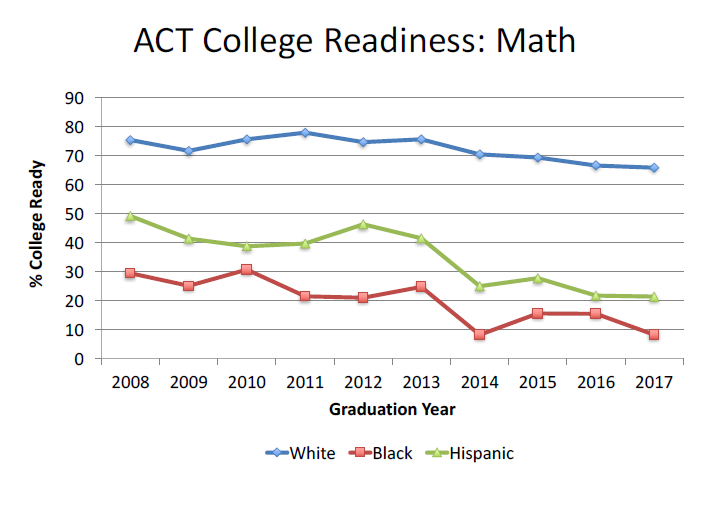
Here are the ACT-based college readiness data in Reading and Math for the MMSD Classes of
2008 through 2017.
As you can see, in the Class of 2017, 12.7% of the Black students met the college readiness
benchmark in Reading (vs. 12.8% the year before and 10.4% in 2014, the first year of universal
test participation in the MMSD) and 8.1% met it in Math (vs. 15.3% the year before and 8.1% in
2014). Those are the same Black students who showed the dramatic single-year increase in
graduation rate of 14.1%. Clearly the increase in graduation rate for the Black students in the
Class of 2017 was not accompanied by an increase in their college readiness. The same is true
for their Hispanic classmates. The disconnect between minority student graduation rates and
minority student achievement is, at best, puzzling (and at worst, alarming).
Question: How are we to understand increasing minority student graduation rates in the
absence of an increase in minority student achievement (defined as college readiness)?
Question: More generally, how are we to understand such high minority student graduation
rates in combination with such low minority student achievement?
These are questions we should all want to know the answers to.
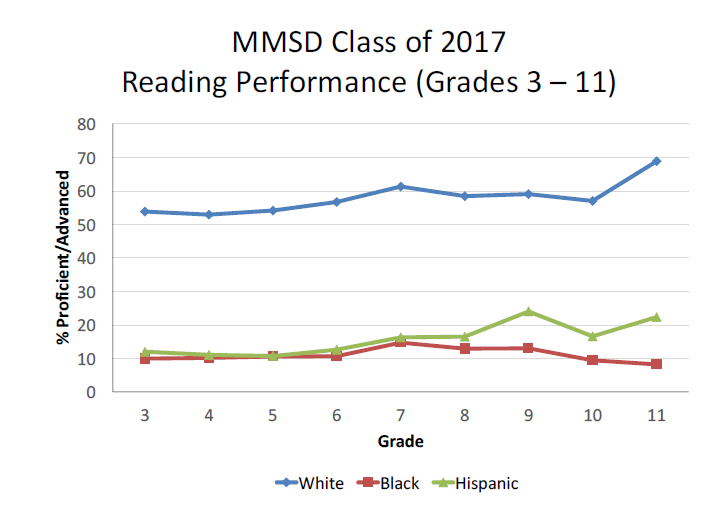
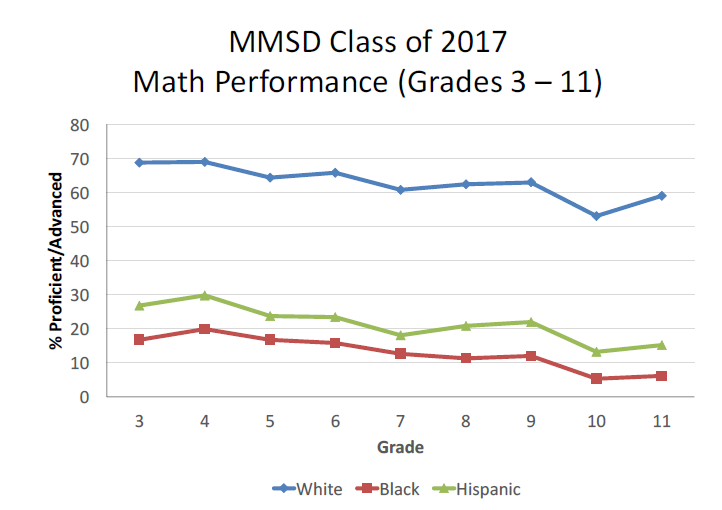
In keeping with recent trends in education research, we wanted to know more about how the
MMSD Class of 2017 fared over time, how their cohort learning profile evolved over their years
as MMSD students. To that end, we looked at the percentage of students in the Class/cohort
who were deemed proficient or advanced in Reading and Math from third grade on.
We undertook this effort with full awareness that a) the District uses different tests to assess
grade level proficiency at different grade levels and, b) there is some variability in the students
tested at each grade level (due to student movement in and out of the District, who shows up
on test day each year, etc.). We moved forward with the analyses despite these obstacles
because a) we believed that since all the tests are used to determine the same thing – grade
level proficiency – there was enough meaningful equivalence across them to warrant the effort,
and b) the changing membership of a cohort over time is a natural limitation of longitudinal
data.
Perfection should not be the enemy of the good, as they say, nor should arguments about an
absence of perfect data be used as an excuse to not look. We need to do the best we can with
the data we have, keeping the problems in mind, but also in perspective.
Here is what we found.
This is what we accomplished with the minority students in the MMSD Class of 2017 over the
course of nine years: little to nothing. No limitation in the data set can explain away these
painful results.
And yet 77% of the Hispanic students and 72.6% of the Black students in the Class of 2017
earned MMSD high school diplomas. Clearly most of them did so without having grade level
skills in reading and math.
We looked at the Classes of 2016 and 2018 and obtained essentially the same results.
Unfortunately, a high school diploma without high school level reading and math skills is of
limited value when it comes to finding success and making a good life post-high school. Thus,
despite our best efforts and multiple Doyle Building and community-based initiatives over the
years, we continue to fail at preparing our minority students for life beyond the MMSD.
This is the proverbial forest. We need to look at it, long and hard. We need to take a break
from looking at individual trees – or worse, single aspects of individual trees. It is critical that
we take in the full landscape. No more hiding or explaining away the heartbreakingly tragic
results. As a community and as a school district, we need to be honest with ourselves about
how dismally we have failed and continue to fail our minority students.
|